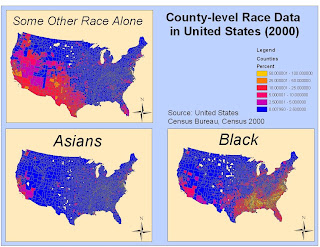
Being able to access Census data from the United States can help explain many things regarding race, ethnicity, and occupation, among other important topics. By mapping racial data for this week’s lab, I can now better see where cultural enclaves exist and can start to explain why things are the way they racially are in America. As a scholar of history, where someone lives can explain a lot around his or her family background and this lab is especially fascinating due to that fact.
Blacks:
Out of 307 million American citizens, 37 million are categorized as African Americans. African American history in the United States unfortunately starts in the 17th century as indentured servants and slaves predominantly in the South. While African Americans are free today, their communities often disproportionally suffer from poverty, failing schools, and crime. As it is easily discernible from the map, a high proportion of African American communities preside in the South and Gulf Coast in states like Louisiana, Virginia, North and South Carolina, Mississippi, and Alabama. The high proportion of blacks in these areas can be traced back to the slavery era and is a sad reminder of America's past.
Asians:
There are almost 11 million Asian Americans and as can be easily seen, most of them reside in coastal areas like California and New York. With Asian Americans being only 5% of the population, counties in the Bay Area and near Los Angeles can be between 10%-25% Asian. The most obvious reason to why Asian communities would be predominantly on the West Coast is a result of geography. China and Japan lie on the Pacific Ocean (as does the West Coast) and throughout the 20th century, people have been coming over from the Pacific Rim via boat and airplane.
Some Other Race:
The "Some Other Race" category is an aggregation of all people whose responses don't fall into the categories of ”White,” “Black or African American,” “American Indian and Alaska Native,” “Asian,” and “Native Hawaiian and Other Pacific Islander.” This category mainly consists of Latino(a) people. As is obvious in the map, a majority of this category resides in the California and the South West (Arizona, Texas, New Mexico, Nevada). According the United States Census Bureau, 97% of respondents within the "Some Other Race" category are Latino(a). The reason for the spatial dispersion of this category is due to the majority of respondents being Latino(a) and the proximity of Mexico and other Central and South American countries to the American Southwest. Also, those are areas where there is already a fairly populous Latin American community with many established cultural centers.
GIS is an amazingly powerful tool that relies on not only a powerful computer, but also a savvy user. Through working with ArcGIS this quarter, I have realized the capabilities of this program yet only feel like I have just scratched the surface of the study. While I am not a geography major, I am exposed to maps everyday being an avid reader of news periodicals and by taking this class I finally understand how maps are made, what they mean, how they are professionally expressed, and most importantly how I can make maps myself. Maps help people understand the world and by taking this class I have enriched my education as to how the world looks and is organized.